- Matplotlib 基础
- Matplotlib - 首页
- Matplotlib - 简介
- Matplotlib - 与 Seaborn 的对比
- Matplotlib - 环境搭建
- Matplotlib - Anaconda 发行版
- Matplotlib - Jupyter Notebook
- Matplotlib - Pyplot API
- Matplotlib - 简单绘图
- Matplotlib - 保存图形
- Matplotlib - 标记
- Matplotlib - 图形
- Matplotlib - 样式
- Matplotlib - 图例
- Matplotlib - 颜色
- Matplotlib - 色图
- Matplotlib - 色图归一化
- Matplotlib - 选择色图
- Matplotlib - 色标
- Matplotlib - 文本
- Matplotlib - 文本属性
- Matplotlib - 子图标题
- Matplotlib - 图像
- Matplotlib - 图像蒙版
- Matplotlib - 注释
- Matplotlib - 箭头
- Matplotlib - 字体
- Matplotlib - 什么是字体?
- 全局设置字体属性
- Matplotlib - 字体索引
- Matplotlib - 字体属性
- Matplotlib - 刻度
- Matplotlib - 线性和对数刻度
- Matplotlib - 对称对数和 Logit 刻度
- Matplotlib - LaTeX
- Matplotlib - 什么是 LaTeX?
- Matplotlib - LaTeX 用于数学表达式
- Matplotlib - LaTeX 在注释中的文本格式
- Matplotlib - PostScript
- 在注释中启用 LaTeX 渲染
- Matplotlib - 数学表达式
- Matplotlib - 动画
- Matplotlib - 艺术家
- Matplotlib - 使用 Cycler 进行样式设置
- Matplotlib - 路径
- Matplotlib - 路径效果
- Matplotlib - 变换
- Matplotlib - 刻度和刻度标签
- Matplotlib - 弧度刻度
- Matplotlib - 日期刻度
- Matplotlib - 刻度格式化器
- Matplotlib - 刻度定位器
- Matplotlib - 基本单位
- Matplotlib - 自动缩放
- Matplotlib - 反转轴
- Matplotlib - 对数轴
- Matplotlib - Symlog
- Matplotlib - 单位处理
- Matplotlib - 带单位的椭圆
- Matplotlib - 脊柱
- Matplotlib - 轴范围
- Matplotlib - 轴刻度
- Matplotlib - 轴刻度
- Matplotlib - 格式化轴
- Matplotlib - Axes 类
- Matplotlib - 双轴
- Matplotlib - Figure 类
- Matplotlib - 多图
- Matplotlib - 网格
- Matplotlib - 面向对象接口
- Matplotlib - PyLab 模块
- Matplotlib - Subplots() 函数
- Matplotlib - Subplot2grid() 函数
- Matplotlib - 固定艺术家
- Matplotlib - 手动等值线
- Matplotlib - 坐标报告
- Matplotlib - AGG 过滤器
- Matplotlib - 带状框
- Matplotlib - 填充螺旋线
- Matplotlib - Findobj 演示
- Matplotlib - 超链接
- Matplotlib - 图像缩略图
- Matplotlib - 使用关键字绘图
- Matplotlib - 创建 Logo
- Matplotlib - 多页 PDF
- Matplotlib - 多进程
- Matplotlib - 打印标准输出
- Matplotlib - 复合路径
- Matplotlib - Sankey 类
- Matplotlib - MRI 与 EEG
- Matplotlib - 样式表
- Matplotlib - 背景颜色
- Matplotlib - Basemap
- Matplotlib 事件处理
- Matplotlib - 事件处理
- Matplotlib - 关闭事件
- Matplotlib - 鼠标移动
- Matplotlib - 点击事件
- Matplotlib - 滚动事件
- Matplotlib - 按键事件
- Matplotlib - 选择事件
- Matplotlib - 透镜
- Matplotlib - 路径编辑器
- Matplotlib - 多边形编辑器
- Matplotlib - 定时器
- Matplotlib - Viewlims
- Matplotlib - 缩放窗口
- Matplotlib 控件
- Matplotlib - 光标控件
- Matplotlib - 带注释的光标
- Matplotlib - 按钮控件
- Matplotlib - 复选框
- Matplotlib - 套索选择器
- Matplotlib - 菜单控件
- Matplotlib - 鼠标光标
- Matplotlib - 多光标
- Matplotlib - 多边形选择器
- Matplotlib - 单选按钮
- Matplotlib - 范围滑块
- Matplotlib - 矩形选择器
- Matplotlib - 椭圆选择器
- Matplotlib - 滑块控件
- Matplotlib - 跨度选择器
- Matplotlib - 文本框
- Matplotlib 绘图
- Matplotlib - 条形图
- Matplotlib - 直方图
- Matplotlib - 饼图
- Matplotlib - 散点图
- Matplotlib - 箱线图
- Matplotlib - 小提琴图
- Matplotlib - 等值线图
- Matplotlib - 3D 绘图
- Matplotlib - 3D 等值线
- Matplotlib - 3D 线框图
- Matplotlib - 3D 表面图
- Matplotlib - Quiver 图
- Matplotlib 有用资源
- Matplotlib - 快速指南
- Matplotlib - 有用资源
- Matplotlib - 讨论
Matplotlib - 滑块控件
介绍
Matplotlib 滑块控件是一个强大的交互式工具,允许用户通过沿预定义轴滑动旋钮来动态控制绘图中的参数。通过使参数变化的影响实时可视化,该控件提供了一种直观且引人入胜的方式来探索变化的影响,从而成为创建交互式数据可视化的宝贵组成部分。
关键特性
以下是 Matplotlib 库中滑块控件的关键特性。
交互式参数控制
滑块控件的主要目的是使用户能够交互式地控制 Matplotlib 绘图中的参数。此参数可以表示各种变量,例如时间、阈值、频率或与可视化相关的任何其他连续参数。
实时更新
当用户沿滑块轴滑动旋钮时,相关参数会实时更新。这提供了即时的视觉反馈,并允许用户观察参数变化如何影响绘图。
与回调函数集成
滑块可以通过允许开发人员定义对滑块值变化做出响应的自定义操作来与回调函数关联。这种灵活性促进了动态和响应式可视化的创建。
可自定义外观
Matplotlib 的滑块控件提供了各种自定义选项,例如通过指定值范围、设置初始值和定义步长来调整滑块的外观。这些功能有助于根据特定的可视化需求定制控件。
注意事项
当我们使用 Matplotlib 滑块控件时,我们必须牢记一些要点。让我们逐一查看它们。
回调效率
当我们将复杂或资源密集型的回调函数与滑块关联时,我们必须考虑优化回调函数的效率,以保持流畅的用户体验。
范围和步长
仔细选择滑块的范围和步长,以确保用户能够轻松导航并找到受控参数的有意义的值。
多个滑块
在某些情况下,如果需要控制多个参数,则考虑使用多个滑块或组合界面,以避免混乱和混淆。
实施
要在 Matplotlib 中创建滑块控件,需要从 matplotlib.widgets 模块导入 Slider 类,并定义回调函数来处理参数更新。以下是一个简单的示例,演示了基本滑块的实现。
在下面的示例中,我们使用了几个函数,下面给出了它们的解释。
update_plot - 此函数在每次移动滑块时都会被调用。它根据滑块的值更新正弦波的 y 值,并重新绘制图形。
Slider - 通过指定轴、标签、值范围(0.1 到 2.0)和初始值(valinit)来创建 Slider 类的实例。
slider.on_changed(update_plot) - 此行将滑块的 on_changed 事件连接到 update_plot 函数,确保在移动滑块时动态更新图形。
示例
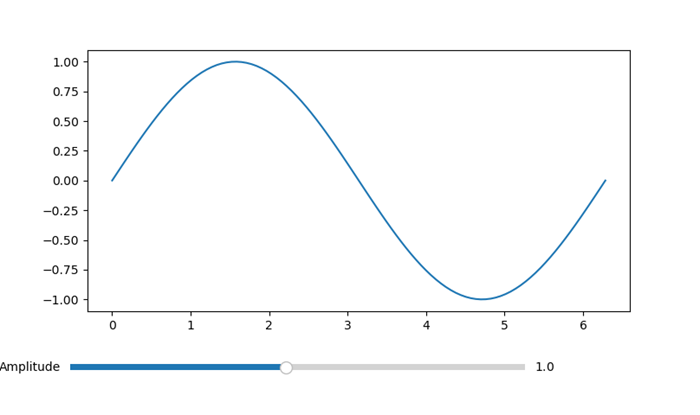
import matplotlib.pyplot as plt
from matplotlib.widgets import Slider
import numpy as np
# Function to update the plot based on the slider value
def update_plot(val):
   amplitude = slider.val
   y = amplitude * np.sin(x)
   line.set_ydata(y)
   fig.canvas.draw_idle()
# Create a figure and axes
fig, ax = plt.subplots()
plt.subplots_adjust(bottom=0.25)
# Generate initial data
x = np.linspace(0, 2 * np.pi, 100)
y_initial = np.sin(x)
# Plot the initial data
line, = ax.plot(x, y_initial)
# Create a Slider
ax_slider = plt.axes([0.1, 0.1, 0.65, 0.03], facecolor='lightgoldenrodyellow')
slider = Slider(ax_slider, 'Amplitude', 0.1, 2.0, valinit=1.0)
# Connect the Slider to the update function
slider.on_changed(update_plot)
plt.show()
输出
初始图形
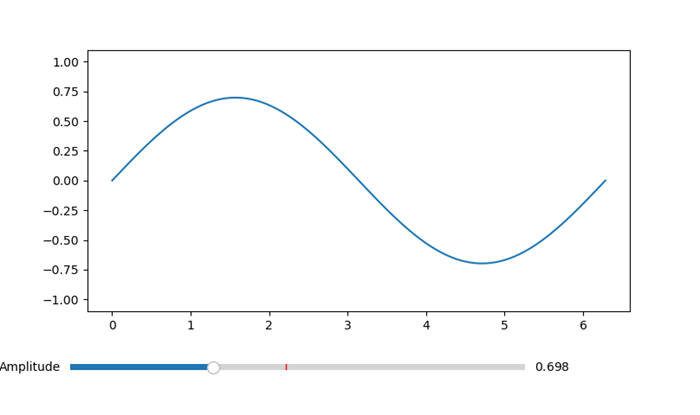
使用滑块降低振幅后的图形
多个滑块示例
这是一个示例,展示了如何在 Matplotlib 图形中使用多个滑块。在本例中,我们将构建一个包含两个滑块的图形,每个滑块用于控制一个不同的参数。随着值的更改,滑块将实时动态更新图形。
示例
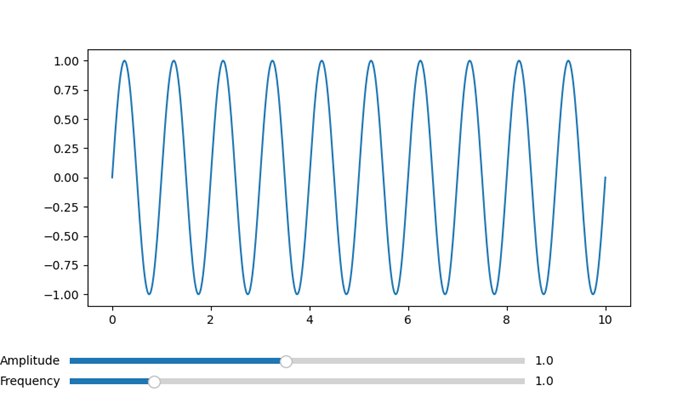
import matplotlib.pyplot as plt
from matplotlib.widgets import Slider
import numpy as np
# Function to be triggered on slider update
def update(val):
   amplitude = slider_amplitude.val
   frequency = slider_frequency.val
   x = np.linspace(0, 10, 1000)
   y = amplitude * np.sin(2 * np.pi * frequency * x)
   line.set_ydata(y)
   fig.canvas.draw_idle()
# Create a figure and axes
fig, ax = plt.subplots()
plt.subplots_adjust(bottom=0.25)
# Initial values
initial_amplitude = 1.0
initial_frequency = 1.0
# Create sliders
ax_amplitude = plt.axes([0.1, 0.1, 0.65, 0.03])
ax_frequency = plt.axes([0.1, 0.05, 0.65, 0.03])
slider_amplitude = Slider(ax_amplitude, 'Amplitude', 0.1, 2.0, valinit=initial_amplitude)
slider_frequency = Slider(ax_frequency, 'Frequency', 0.1, 5.0, valinit=initial_frequency)
# Connect sliders to the update function
slider_amplitude.on_changed(update)
slider_frequency.on_changed(update)
# Plot initial data
x = np.linspace(0, 10, 1000)
y = initial_amplitude * np.sin(2 * np.pi * initial_frequency * x)
line, = ax.plot(x, y)
plt.show()
输出
初始图形
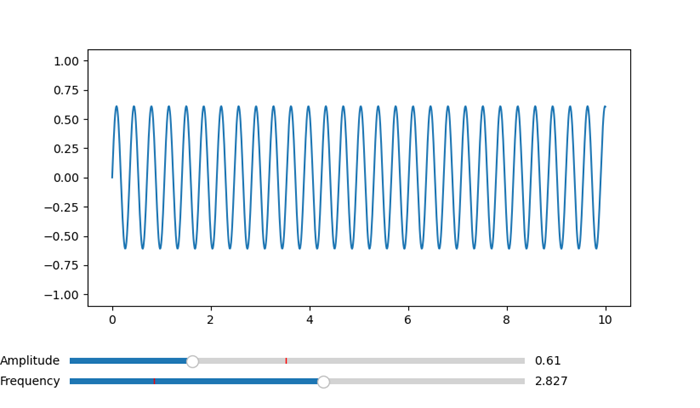
频率和振幅变化后的图形
用例
以下是 Matplotlib 库中滑块控件的用例。
- 参数探索 - 滑块对于探索科学、工程或数据分析应用中更改参数的影响非常有价值。用户可以平滑地调整参数以观察其影响。
- 实时数据操作 - 滑块通常用于实时数据可视化,在实时数据可视化中,用户需要交互式地控制诸如缩放级别、时间间隔或数据阈值等方面。
- 模型调整 - 在机器学习或模拟场景中,滑块可用于动态调整模型参数或输入变量,从而提供一种手动调整模型的方法。
- 交互式仪表板 - 滑块是交互式仪表板的组成部分,使用户能够即时控制和自定义显示的数据。
自定义
可以根据特定的设计偏好自定义 Matplotlib 滑块控件的外观和行为。关键自定义选项如下所示。
方向:根据可视化布局,滑块可以是水平的或垂直的。
颜色和样式 - 自定义滑块旋钮、滑块轨道和其他组件的颜色和样式,以匹配整体设计。
刻度标记和标签 - 指定滑块轴上刻度标记和标签的存在和格式,以提高可读性。
对数刻度 - 滑块可以在对数刻度上运行,这对于可视化具有广泛数量级范围的数据很有用。
最后,我们可以说 Matplotlib 的滑块控件是创建交互式和用户友好型数据可视化的通用工具。无论用于探索数据、调整模型还是在仪表板中提供动态控制,滑块都增强了 Matplotlib 图形的交互性。实时更新、自定义选项和与回调函数集成的组合使滑块成为创建引人入胜且信息丰富的可视化的强大组件。